iPhone Manager
Manage iOS Data
iPhone Data Recovery
Recover iOS Data
iPhone Data Eraser
Wipe iOS Data
Android Manager
Manage Android data
Android Data Recovery
Recover Android Data
Android Data Eraser
Wipe Android DataPhone Transfer
Transfer Data Between Phones
Data Recovery
Recover Lost Data
iOS Backup and Restore
Back Up & Restore iOS DataWhatsApp Transfer
Transfer WhatsApp Chats
PC Data Recovery
Recover PC Data
Android Backup and Restore
Back Up & Restore Android DataWhatsApp Transfer for iOS
Transfer iPhone WhatsApp Chats
WhatsApp Recovery
Recover WhatsApp Chats
Windows Backup
Back Up & Restore PC Data
Data Manager
Manage Phone and Data
Broken Android Data Recovery
Recover Broken Android
Mac Backup
Back up & Restore Mac Data
Partition Manager
Manage Partitions on PC
Photo Recovery
Recover Photos and Videos
Data Wipe
Erase Data, Folders & Drives
iOS System Recovery
Repair iOS System
Location Changer
Change Virtual Location
PDF Editor
Edit PDF Files
iTunes Repair
Repair iTunes Issues
Screen Mirror
Mirror Phone Screen
PDF Converter
Convert PDF Files
iPhone Unlocker
Unlock iOS Devices
Parental Control
Phone Monitoring App
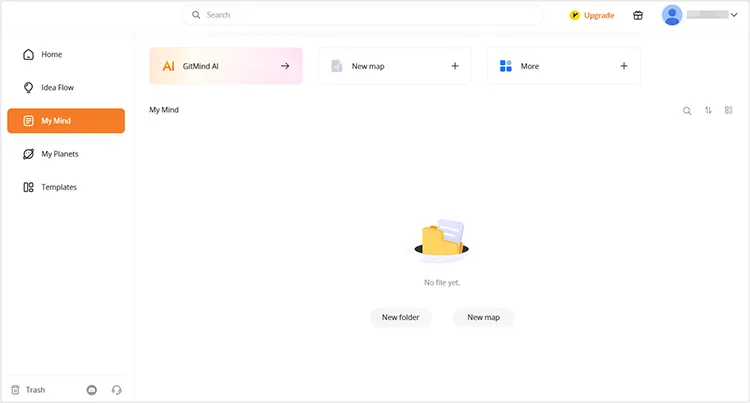
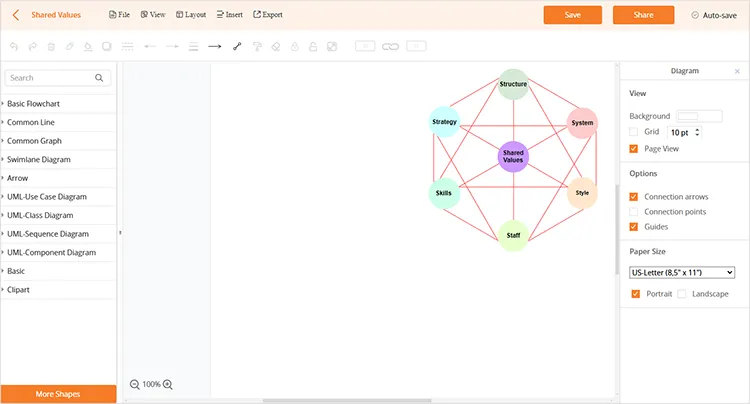
Mind Map Maker
Mind Mapping
Android Unlocker
Unlock Android DevicesWhatsApp Tracker
WhatsApp Tracking Tool
Screen Recorder
Record Screen on PCVideo Compressor
Compress Video SizeVideo Watermark Maker
Best Watermark Adder for VideosVideo Editor
Simple Video EditingVideo Merger
Merge Two or More VideosGIF Maker
Make GIFs from Video/PhotoVideo Downloader
Download Videos AnywhereVideo Trimmer
Trim and Edit Video ClipsBackground Noise Removal
Noise Reduction from Audio/Video
Video Converter
AI Video ConverterVideo Cropper
Best Video Cropper to Crop VideosVolume Booster
Sound Booster to Turn Volume UpVideo Player
Best Media Player for Windows PCVideo Speed Controller
Speed Up or Slow Down a Video
Screen Capture
Capture Screen on PCBackground Remover
Remove Image BackgroundText to Speech
AI Text to Speech GeneratorFile Repair
File/Video/Photo RestorationWatermark Remover
Remove Photo & Video WatermarkVoice Generator
AI Voice Generator & ClonerAI Photo Editor
Edit Pictures with AI Image EditorObject Remover
Remove Video Objects/PeopleVoice Changer
Real Time AI Voice ChangerThumbnail Maker
Best YouTube Thumbnail Maker
Photo Enhancer
Best AI Image EnhancerAI Music Generator
Best AI Song GeneratorAI Writer
Best AI Writing Generator
Video Enhancer
Enhance and Adjust VideosAI Video Generator
Convert Text to Videos with AI

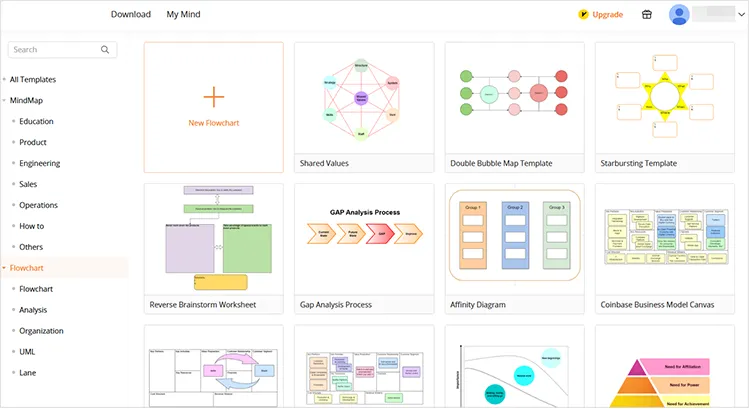
 Extensive Templates
 Customization Options
 AI Assistance